

Percentage to GPA Calculator: Convert Your Grade Fast
When you are preparing college applications, submitting scholarship forms, or transferring to a new school system, you will likely hit a major bureaucratic roadblock: your grades are recorded as percentages (like 88% or 93%), but the admissions office strictly demands a standard 4.0 Grade Point Average (GPA).
Trying to figure out exactly where your academic standing sits on a standard scale can feel confusing. Different schools use completely different rules to translate these values.
This comprehensive guide breaks down the core math, provides a standard reference conversion table, and offers a dynamic tool to instantly clear up the confusion.
Why Converting Percentages to GPA Matters
Related Reading: Check out our guide on Chinese CSC Scholarship 2027: Guide & Apply
Most international educational systems and historical high school transcripts record your final performance as raw percentages out of 100. However, the standard higher education landscape globally relies heavily on the 4.0 unweighted scale to evaluate applicants on an identical playing field.
If you don't translate your scores accurately, you risk either selling your achievements short or submitting a mismatched application that delays your admission tracking.
Using an automated tool or an official conversion approach ensures your records align perfectly with what institutional evaluation boards expect to see.
Interactive Percentage to GPA Simulator
To see how your specific numeric averages translate across varying standard school scales, adjust the input variables below. This simulator lets you test multiple scenarios instantly.
The Standard 4.0 Scale Conversion Table
If you prefer referencing raw numbers manually, schools typically look at a standardized bracket structure. The matrix below shows the standard conversion layout utilized by a majority of secondary and post-secondary establishments.
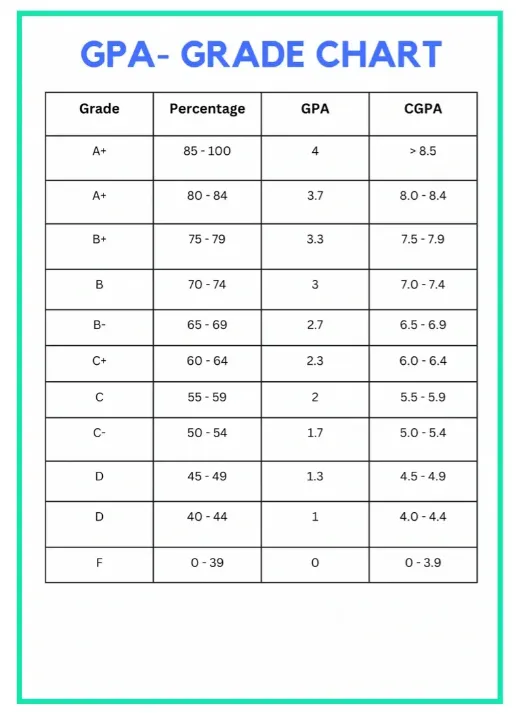
| Percentage Range | Letter Grade | Standard 4.0 GPA Value |
| 93% – 100% | A | 4.0 |
| 90% – 92% | A- | 3.7 |
| 87% – 89% | B+ | 3.3 |
| 83% – 86% | B | 3.0 |
| 80% – 82% | B- | 2.7 |
| 77% – 79% | C+ | 2.3 |
| 73% – 76% | C | 2.0 |
| 70% – 72% | C- | 1.7 |
| 67% – 69% | D+ | 1.3 |
| 65% – 66% | D | 1.0 |
| Below 65% | F | 0.0 |
Keep in mind: This represents a generic unweighted system. Some institutions evaluate a 90% score as a flat 4.0, while others apply strict fractional drops for minus grades. Always check your target institution's specific policy.
How the Conversion Math Works Behind the Scenes
If you ever need to calculate a quick unweighted conversion baseline by hand without a chart, you can use a basic linear formula. This method assumes that a 100% maps directly to a 4.0, and a 60% maps directly to a 0.0.
The standard mathematical formula looks like this:
GPA = Percentage - 60/10
Worked Example:
If your overall class average is 85%:
-
Subtract 60 from your percentage: 85 - 60 = 25$
Divide the result by 10: 25/10 = 2.5
Using this direct linear approach, an 85% converts roughly to a 2.5 GPA. However, note that most schools prefer the bracket table method over linear math because it rewards high-bracket performance more fairly.
The Overlooked Trap: Credit Hour Weighting
Many students make the mistake of simply adding up all their class percentages, dividing by the number of classes, and converting that single final number. Doing this can completely break your accurate score.
Academic averages must be calculated as a weighted average based on credit hours.
A 5-credit organic chemistry class where you earned an 80% affects your overall standing significantly more than a 1-credit physical education elective where you scored a 98%.
The Right Way to Calculate Your Cumulative Score:
-
Convert each individual course percentage grade into its corresponding 4.0 decimal point using our table.
Multiply that decimal value by the total number of credit hours assigned to that specific class. This gives you your Quality Points.
Add up all the Quality Points across your courses.
Divide that grand total of Quality Points by the overall number of credits you attempted.
Pro-Tips for Advanced Scale Navigations
-
Spot the Difference in Weighted Scales: High school systems frequently reward advanced placement courses (like AP or IB tracks) by utilizing a 5.0 weighted scale. An "A" grade in an advanced class can yield a 5.0 value, boosting your cumulative average past the standard unweighted boundaries.
Watch Out for Strict Verification Agencies: If you are an international applicant looking to enter a foreign university system, avoid relying solely on basic online estimation scripts for your official documentation. Establishments often require formal validations processed by certified auditing services like WES (World Education Services).
Expert Recommendations Summary
Accurately tracking your academic conversion metrics is vital for building a competitive academic portfolio. Never guess your numbers or leave them loosely translated on a formal resume submission. Use a standard baseline bracket layout, weight your classes properly according to their individual course unit value, and match your metrics against the specific guidelines published by your target admissions board.